Beyond the 70% Savings Claim — A Transparent, Number-Grounded Guide to True ROI for B2B Furniture Importers: Distributors, Agents, Showrooms, Interior Designers, and Hotel Fit-Out Specialists
Introduction: What No One Tells You About the “70% Savings”
The claim appears in sales emails, at trade fairs, and in sourcing agency pitch decks with remarkable consistency: “Source furniture from China and save up to 70% compared to domestic pricing.” It is not technically false. Factory-gate pricing in Foshan or Linyi can genuinely be 60–75% below the US retail equivalent of the same piece. The problem is that factory-gate pricing and landed cost are separated by a journey — physical, regulatory, financial, and administrative — that adds between 40% and 80% to what you actually pay before a single piece of furniture reaches your warehouse floor.
For experienced B2B importers — furniture distributors, showroom operators, hotel fit-out specialists, and interior designers managing residential project sourcing — this gap is not news. But the specific cost components, their current magnitudes, and the way they interact to erode margins that look healthy at the quotation stage and disappointing at the invoice reconciliation stage deserve systematic, transparent analysis.
This guide provides exactly that. Every cost category is named, defined, quantified with current market ranges, and illustrated with worked examples. By the end, you will have the framework to calculate accurate landed costs, build defensible ROI projections, and make sourcing decisions backed by financial analysis rather than marketing claims.
1. The Myth of 70% Savings: Deconstructing Marketing Claims
Why Manufacturers Quote Unrealistic Percentages
The “70% savings” figure is almost always calculated by comparing a Chinese factory’s FOB (Free on Board — the price at which the supplier delivers goods to the origin port, with all further costs borne by the buyer) price against a US or European retail price. That comparison is technically valid but commercially misleading, because it conflates two fundamentally different economic points: the factory gate and the buyer’s warehouse, separated by a chain of costs that runs from inland trucking to port, through ocean freight, tariffs, customs clearance, domestic delivery, and inventory carrying — none of which appear in a manufacturer’s FOB quotation.
A second structural distortion: FOB quotations from Chinese manufacturers typically exclude sample costs, tooling fees for custom designs, quality inspection costs, and the cost of any defective units that will appear in every production run at statistically predictable rates. Including these excluded costs immediately reduces the apparent saving by 5–15 percentage points before the first container is loaded.
Understanding Factory Pricing Models
FOB (Free on Board) pricing is the most common export quotation structure from Chinese manufacturers. The seller’s price covers manufacturing and delivery of goods to the named origin port; risk and cost transfer to the buyer from that point. FOB gives buyers the clearest view of manufacturing cost, but requires the buyer to arrange and pay for everything from the port forward.
CIF (Custo, Seguro e Frete) pricing includes the seller’s choice of ocean freight and basic insurance to the destination port. While it appears simpler, experienced importers note that supplier-arranged freight consistently runs 8–12% higher than buyer-arranged equivalent routes because the supplier has no incentive to optimize your logistics spend. For B2B importers with established freight forwarder relationships, FOB is almost always the better commercial choice.
The Real Savings Range for B2B Importers
Realistic Net Savings Range — China Import vs. US Domestic/Retail (After All Costs), By Furniture Category
Estimates include tariffs, ocean freight, customs clearance, QC inspection, and standard domestic delivery. US Section 301 (25%) + Section 122 (10%) tariffs applied to Chinese-origin goods. Actual ranges vary by order volume, destination, and current freight market.
2. Manufacturing and Production Costs: The Foundation

Premium upholstered furniture — the category where manufacturing cost, customisation fees, and QC investment intersect to define true sourcing economics.
Per-Unit Manufacturing Expenses
The base manufacturing cost quoted by a Chinese factory is itself a composite of several sub-costs that fluctuate independently. Raw material costs — timber, foam, fabric, hardware — are subject to commodity price movements that can shift between order placement and production start. A 15% increase in rubberwood prices (driven by Southeast Asian supply disruptions in 2023–2024) directly increased per-unit manufacturing costs for solid wood dining furniture by approximately 8–12% mid-season for buyers with open purchase orders. Raw material clauses in supply contracts — which allow manufacturers to adjust pricing if input costs move beyond a defined threshold — are standard in professional manufacturing relationships and should be read carefully before signing.
Labour costs in Foshan’s furniture manufacturing cluster have risen approximately 6–8% annually over the past five years, driven by China’s minimum wage escalation and the competition for skilled workers (CNC operators, upholstery craftspeople, finishing specialists) from adjacent industries. This trend has not reversed the cost advantage of Chinese manufacturing — it has narrowed it modestly at the base manufacturing level while simultaneously driving quality improvements as factories invest in automation to reduce labour dependency.
Minimum Order Quantities (MOQs) and Unit Economics
MOQ (Minimum Order Quantity — the smallest number of units a manufacturer will produce in a single run) has a non-linear relationship with per-unit cost that catches many first-time importers by surprise. The break in unit economics between 50 and 100 units is typically 12–20%; the break between 100 and 300 units is a further 15–25%. Buyers who order at or near the MOQ threshold are, in effect, paying a “small batch premium” that does not appear as a line item on the quotation — it is embedded in the unit price itself.
The secondary MOQ cost is inventory carrying: large orders placed to reach favourable unit pricing tie up capital in a warehouse for months. The industry benchmark for inventory carrying cost (the annual cost of holding physical stock, including capital cost, insurance, handling, and obsolescence risk) is 20–30% of inventory value per year. A $100,000 furniture order that takes 4 months to sell carries approximately $7,000–$10,000 in carrying cost before a single piece is delivered to a client — a cost that is invisible in the per-unit price but very real in the P&L.
Customization and Design Modifications
| Customisation Type | Typical Cost Range | Lead Time Impact | Refundable Against Bulk Order? |
|---|---|---|---|
| Material / colour substitution | $0–$200 per SKU | +0–2 weeks | Yes (typically) |
| Dimensional adjustment (<15%) | $50–$300 per SKU | +1–3 weeks | Partial / negotiable |
| New mould / tooling (legs, hardware) | $500–$3,000 per tool | +3–6 weeks | Rarely (tooling is one-time capex) |
| Full bespoke design (from brief) | $300–$1,500 per piece | +4–8 weeks | Partial (negotiated per project) |
| Pre-production sample | $150–$800 per sample | +2–5 weeks | Yes (credited to first bulk order) |
| Sample revision (round 2+) | $100–$400 per revision | +1–3 weeks each | Rarely |
Table 1: Customisation Cost Ranges for Chinese Furniture Manufacturing (2025 Market Reference)
3. Quality Control and Inspection Costs
Third-Party Inspection Services
Quality control inspections are the most reliably cost-positive investment in the entire furniture import process — meaning that every dollar spent on inspection returns multiples in prevented claim costs. Industry QC audit data shows that uninspected furniture shipments from Chinese factories have defect rates of 8–30% depending on factory tier and product complexity. Third-party pre-shipment inspections typically catch 85–95% of production defects before container loading, converting post-delivery warranty claims (which cost the full replacement, reshipping, and client relationship management expense) into factory-resolved issues (which cost the inspection fee plus rework).
Three inspection stages serve distinct purposes in professional procurement:
Pre-Production Inspection (PPI) — conducted before raw material cutting begins, confirming that materials match the approved specification. This is the highest-leverage intervention: catching a wrong-grade foam or off-spec timber at the PPI stage costs nothing to correct; catching it after 200 pieces have been upholstered costs the full production run.
In-Process Quality Check (IPC) — conducted at 30–50% production completion. Validates that approved construction methods are being followed and catches process deviations early enough to correct before completion.
Final Quality Control (FQC / Pre-Shipment Inspection) — conducted on finished goods before container loading, using AQL 2.5 sampling (Acceptable Quality Level — a statistical standard defining the maximum acceptable defect rate; AQL 2.5 means that if more than 2.5% of sampled pieces have critical defects, the shipment fails inspection). This is the non-negotiable stage: every B2B importer should conduct an FQC regardless of supplier relationship maturity.
Pre-Production Inspection (PPI)
$200–$350 / dayVerifies raw materials match spec before production begins. Most cost-effective correction point. Third-party firms: SGS, Bureau Veritas, Intertek.
In-Process Quality Check (IPC)
$200–$350 / dayValidates construction methods at 30–50% completion. Catches process deviations before full production run is committed.
Final Pre-Shipment Inspection (FQC)
$250–$400 / dayAQL 2.5 random sampling of finished goods. Non-negotiable for all professional B2B importers. Covers 100–500 pieces per day depending on product complexity.
Full 3-Stage QC Programme
$600–$2,000 / orderBudget 1–3% of order value for comprehensive inspection coverage. Returns 10–20x in prevented defect claim costs on an average order.
Hidden Quality-Related Expenses
The true cost of a quality failure discovered after container clearance runs far beyond the replacement value of the defective pieces. For a $50,000 furniture order with a 10% defect rate (50 units requiring replacement), the direct replacement cost is approximately $5,000 — but the total economic impact includes: air freight for emergency replacement pieces ($1,500–$4,000), the labour cost of defect documentation and communication ($500–$1,500), client relationship management time (impossible to cost but very real in a referral-dependent B2B business), and the opportunity cost of the capital tied up in defective inventory while replacement is arranged. Industry experience suggests total defect cost typically runs 3–5x the nominal replacement value of the defective units when all these components are included.
4. Shipping and Logistics: The Major Hidden Expense

Container logistics is the single largest hidden cost in furniture importing — with rate volatility, surcharges, and seasonal premiums that can swing total shipping costs by 40–60% within a single year.
Ocean Freight Calculations
Ocean freight is the cost category that most consistently surprises first-time importers, for two reasons. First, the headline container rate (the price for moving a steel box from Port A to Port B) is only one component of the total freight bill — port handling fees, documentation fees, fuel surcharges, peak-season surcharges, and origin charges all add to the base rate. Second, ocean freight rates are notoriously volatile: FCL rates from China to the US West Coast ranged from $1,500 to $16,000 per 40-foot container between 2020 and 2025 — a 10x swing that made margin planning extraordinarily difficult for buyers locked into annual purchasing commitments at fixed sell prices.
FCL (Full Container Load) — where you fill an entire container (20-foot = ~25–28 CBM usable volume; 40-foot = ~58–62 CBM) — is the cost-efficient option for large orders. The container rate is fixed regardless of how efficiently it is packed, so maximising CBM utilisation directly reduces per-unit freight cost. Professional packing teams at leading manufacturers like those in Foshan’s Longjiang district consistently achieve 90–95% container fill rates, which meaningfully lowers per-unit freight versus buyers who accept factory-standard packing without optimisation.
LCL (Less than Container Load) — where your goods are consolidated with other shippers’ cargo — is priced per CBM and is cost-effective for small shipments but expensive at scale. LCL also introduces additional handling, consolidation/deconsolidation fees, and a higher damage risk due to multiple loading and unloading events.
| Cost Component | FCL (40ft) to US West Coast | FCL (40ft) to US East Coast | FCL (40ft) to Europe |
|---|---|---|---|
| Base ocean freight rate | $2,500–$4,500 | $3,500–$6,500 | $2,000–$4,500 |
| Origin port handling (THC) | $150–$300 | $150–$300 | $150–$300 |
| Documentation / B/L fee | $50–$150 | $50–$150 | $50–$150 |
| Fuel surcharge (BAF/EBS) | $200–$500 | $200-$600 | $150–$400 |
| Destination port handling | $300–$600 | $400–$800 | $250–$500 |
| Inland freight (port → warehouse) | $400–$1,200 | $400–$1,200 | $200–$800 |
| Cargo insurance (0.5% of cargo value) | $150–$500 (on $30K–$100K cargo) | $150–$500 | $150–$500 |
| Peak season surcharge (Q3–Q4) | $300–$800 additional | $300–$800 additional | $200–$600 additional |
| Total shipping cost range | $3,850–$8,550 | $5,000–$10,850 | $3,100–$7,750 |
Table 2: All-In Ocean Freight Cost Breakdown — 40ft FCL from Foshan/Guangdong, 2025–2026 Reference Rates (Freightos, Exfreight, industry data)
Air Freight Considerations
Air freight for furniture is economically viable only in a narrow set of circumstances: samples (where the information value of receiving the piece quickly outweighs the premium cost), replacement pieces for defective units in an urgent client project (where the cost of delay exceeds the freight premium), and ultra-high-value, low-volume pieces where the per-kilogram freight cost is small relative to the piece value. At approximately $6–$12 per kilogram from China to the US, air freight on furniture averaging 15–25 kg per piece runs $90–$300 per piece in freight alone — compared with $15–$40 per piece ocean freight at scale. The ratio makes air freight commercially irrational for any regular import programme.
5. Tariffs, Duties, and Trade Compliance
Understanding Tariff Classifications
Every imported furniture piece is classified under a specific HS code (Harmonized System code — the international standardised numerical code identifying the product type, which determines which tariff rate applies). Furniture is primarily classified under HTS Chapter 94 in the US system. Critically, small differences in construction, material, or intended use can shift a piece between tariff categories with meaningfully different duty rates. A solid wood chair and a chair with any upholstery element may fall under different HS codes with different tariff implications — a distinction that is not always obvious from visual inspection and is frequently misclassified by importers without specialised customs expertise.
The current tariff architecture for furniture imported from China into the US involves three layers:
Base MFN Rate (Most Favoured Nation — the standard tariff rate applied to imports from WTO member countries in normal trade relations): Most furniture categories enter at 0%, meaning the base rate adds nothing.
Section 301 Tariff: A 25% surcharge applied specifically to Chinese-origin goods across most furniture categories as part of the US-China trade dispute tariff programme. This 25% is applied to the customs value of the goods (the declared value, typically close to FOB price) and is the single largest tariff cost component for Chinese furniture imports.
Section 122 Tariff (effective February 2026): A 10% universal surcharge applying to imports from most countries. Combined with Section 301, this creates an effective 35% tariff burden on Chinese furniture for categories with a 0% base rate.
Landed Cost Composition — $100 FOB Chinese Furniture (US East Coast Destination, 2026)
Illustrative distribution for a $100 FOB unit delivered to US East Coast warehouse. Tariff stack: 25% Section 301 + 10% Section 122 = 35% on FOB value. Total landed cost ≈ $192 on a $100 FOB unit. Actual proportions vary by product, destination, and order volume.
Trade Compliance and Documentation
Tariff misclassification — assigning an incorrect HS code to an imported product — carries penalties of 20–40% of duties owed, in addition to paying the correct duty amount retroactively. US Customs and Border Protection (CBP) conducts random and targeted audits of furniture importers, and misclassification of Chinese-origin goods (where the financial incentive to underclassify is highest due to the Section 301 surcharge) is a documented enforcement priority. The only reliable protection is working with a licensed customs broker — a federally licenced professional who classifies your goods, prepares entry documentation, and maintains liability for classification accuracy.
Duty drawback programmes — which allow importers to recover duties paid on imported goods that are subsequently re-exported as part of a finished product — are available for some furniture categories and worth investigating with a customs attorney if you re-export any portion of your imported furniture inventory.
6. Customs Clearance and Import Administration
Broker and Clearance Fees
Customs Broker Service Fee
$150–$500 / entryLicensed broker’s professional fee for classifying goods, preparing entry, and filing with CBP. Non-negotiable for professional B2B imports.
Merchandise Processing Fee (MPF)
0.3464% of valueUS government fee on formal entries. Minimum $32.71, maximum $634.62 per entry (2026 rates). Applied to declared customs value.
Harbor Maintenance Fee (HMF)
0.125% of valueApplied to ocean freight imports. On a $50,000 shipment: approximately $62.50 — small but must be budgeted.
ISF Filing (US-specific)
$25–$75 / shipmentImporter Security Filing: must be submitted to CBP at least 24 hours before vessel departure from China. Late filing penalty: $5,000 per violation.
Demurrage / Detention
$100–$500 / dayCharges for containers held at port beyond the free-time period (typically 3–7 days). CBP-hold delays are the most common trigger — budget 3–5 day buffer.
CARB / Safety Compliance Testing
$500–$3,000 / product typeRequired for composite wood products (CARB Phase 2), children’s furniture (CPSIA), and fire safety (CAL 117). One-time per product design but must be current (within 24 months).
Potential Delays and Associated Costs
CBP holds — random or targeted inspections of containers at the port — are the most expensive delay trigger in the clearance process. A container placed on hold can sit at the port for 3–14 days, during which demurrage charges accrue at $100–$500 per day depending on port and shipping line. More significantly, the goods are unavailable during this period, which can trigger client delivery penalties in a project furniture context or missed seasonal selling windows in a showroom context. The hold rate for Chinese furniture containers at US ports is estimated at 5–10% of shipments, making it a genuine risk worth modelling in delivery timeline planning.
🎬 Expert Guide: Importing Furniture from China — What the Cost Breakdown Really Looks Like
This comprehensive video walkthrough covers the full import process — from factory pricing and tariff calculations to logistics and customs reality — essential viewing for B2B buyers evaluating or scaling a China furniture import programme.
7. Currency Fluctuations and Payment Terms
Foreign Exchange Risk Management
Most furniture purchases from Chinese manufacturers are quoted and invoiced in USD — but the underlying manufacturing costs are in Chinese Renminbi (RMB/CNY). This means that CNY/USD exchange rate movements directly affect the manufacturer’s economic position: when the CNY strengthens against the USD (meaning each dollar buys fewer yuan), manufacturers face pressure to increase USD prices to maintain their CNY margins. A sustained 5% CNY appreciation can translate into 3–8% USD price increases on renewal quotations, depending on how much of the manufacturer’s cost base is in CNY versus USD-denominated inputs (imported raw materials, USD-priced machinery).
For buyers placing large orders (above $50,000 equivalent), forward contracts (agreements to purchase a fixed amount of currency at a predetermined rate at a future date) provide meaningful protection against adverse exchange rate movements between order placement and payment. The cost of a forward contract (the “forward premium” or “discount” relative to the spot rate) typically runs 0.5–2% annually depending on the currency pair and tenor — a modest insurance cost relative to the margin risk of an unhedged 5–8% exchange rate swing.
Payment Term Negotiations
| Payment Structure | Typical Use Case | Cost to Buyer | Risk Level |
|---|---|---|---|
| 50% deposit / 50% before shipment | New supplier, small orders (<$20K) | Highest capital tie-up | Low (shared risk) |
| Depósito de 30% / 70% contra B/L | Standard for established B2B relationships | Moderate capital exposure | Low-Moderate |
| 30% deposit / 70% net-30 after delivery | Mature relationships, high-volume accounts | Lower capital tie-up | Moderate (supplier credit risk) |
| Carta de crédito (LC) | Large orders ($50K+), new suppliers | LC fee: 0.5–2% of LC value | Very Low (bank-guaranteed) |
| Wire transfer fees | All payment methods | $15–$50 per transfer + FX spread 0.5–2% | Operational (not commercial) |
Table 3: Payment Term Structures for Chinese Furniture Sourcing — Cost and Risk Comparison
8. Warehouse, Storage, and Inventory Management
Pre-Shipment and In-Transit Storage
Factory warehousing before shipment is often overlooked in landed cost calculations because it is invisible in most supplier quotations. Manufacturers who have completed your order but are awaiting your shipping instructions — because you are optimising container loading, coordinating with another supplier, or simply slow to issue the booking — typically charge warehousing fees after a free period of 7–14 days. These charges run $0.05–$0.15 per CBM per day in a Foshan factory warehouse, which sounds trivial — until a 30 CBM order sits for 3 weeks and accumulates $31–$94 in storage charges plus the opportunity cost of delayed receipt.
Port storage (bonded warehouse or terminal storage) is significantly more expensive: $1,000–$3,000 per 40-foot container for the first week, escalating to $200–$500 per day after the free-time period expires. A container arriving at Los Angeles port during peak season congestion (typically November–January) can easily accumulate $3,000–$8,000 in port storage charges if the clearance process is delayed — a cost that appears nowhere in a shipping quotation and is entirely borne by the importer.
Domestic Warehouse and Distribution
Domestic furniture warehousing in the US runs $0.50–$2.00 per square foot monthly depending on location, climate control, and handling services. For a B2B furniture importer, the practical cost is better expressed as a percentage of inventory value: the industry benchmark of 20–30% annual carrying cost encompasses capital cost (the return you are not earning on capital tied up in inventory), storage rent, handling labour, insurance, damage and shrinkage allowances, and the obsolescence risk of designs that lose market relevance while sitting in a warehouse. A $200,000 inventory position carries $40,000–$60,000 in annual carrying cost — a number that fundamentally changes the economics of large buffer-stock strategies.

The warehouse is where inventory carrying costs accumulate invisibly — 20–30% of inventory value annually in capital, storage, handling, and obsolescence costs that most import ROI calculations fail to model accurately.
9. Hidden Administrative and Operational Costs
Internal Resource Allocation
The administrative time consumed by international furniture sourcing is chronically undercosted in ROI models because it is absorbed by existing staff rather than appearing as a discrete line item. A senior buyer or product manager spending 15 hours per week managing Chinese supplier communications, sample approvals, inspection coordination, and logistics follow-up represents $30,000–$70,000 annually in allocated labour cost (at professional salary levels) that is invisible in the furniture import P&L but very real in the human capital budget. Sourcing programmes that appear marginally profitable when only direct costs are counted become clearly loss-making when internal resource allocation is included at fully-burdened staff cost rates.
Factory visits and audit travel add $3,000–$8,000 per trip (flights, accommodation, in-country transport, translation services for non-Mandarin-speaking buyers) — typically 1–3 trips per year for an active direct-import programme. Remote supplier management through video audit services (specialised firms provide factory video walk-throughs on demand for $200–$500 per session) represents a cost-efficient alternative that has become standard practice since 2020.
Compliance and Regulatory Requirements
✓ Compliance Documentation — What You Need Before Selling Furniture in the US Market
- CARB Phase 2 compliance certificate (for all composite wood panel content — MDF, plywood, particleboard) — $1,000–$2,000 per product type, valid for 24 months
- CPSIA compliance documentation for any furniture marketed to children under 12 — $500–$2,000 per product, plus lead and phthalate testing
- CAL 117 fire retardancy certification for upholstered furniture intended for California or high-occupancy use — test report required, not self-declaration
- FSC Chain of Custody documentation if making sustainability claims — annual audit fee $1,500–$5,000 for the certification body
- ASTM F2057 compliance for freestanding clothing storage units (anti-tip requirements) — structural engineering documentation required
- Product liability insurance — $2,000–$8,000 annually for a furniture distribution business, essential for US market
- Import records retention — CBP requires 5-year record retention of all entry documentation; digital record management systems cost $200–$800 annually
Technology and Systems Integration
Professional import operations require technology infrastructure that carries ongoing cost: supplier management platforms ($100–$500/month), inventory management systems with international SKU tracking ($200–$1,000/month depending on complexity), quality management systems for documenting inspection results and defect history ($150–$600/month), and EDI (Electronic Data Interchange — standardised electronic communication format for purchase orders, advance ship notices, and invoices) infrastructure for buyers supplying major retail accounts ($500–$2,000 setup plus $200–$800/month). These technology costs are legitimate business investments, but they belong in the import programme cost model, not the general overhead allocation.
10. Calculating True ROI: A Step-by-Step Framework
Building Your Complete Cost Model
The only ROI calculation that matters for furniture import decision-making is the landed cost per unit — the total of every cost incurred from factory quotation to warehouse receipt, divided by the number of saleable units delivered. Every cost category covered in Sections 2–9 of this guide must appear in this calculation. The formula below organises them into a logical sequence:
+ Inland freight to origin port
+ Ocean freight (per unit = total container cost ÷ units shipped)
+ Origin port handling (THC, documentation, B/L)
+ Cargo insurance (0.3–0.8% of shipment value ÷ units)
+ Import tariff (FOB value × applicable tariff rate %)
+ Customs broker fee (÷ units)
+ MPF + HMF fees (÷ units)
+ Destination port handling (÷ units)
+ Domestic inland freight to warehouse (÷ units)
+ QC inspection cost (÷ units)
+ Sample cost allocation (amortised over first bulk order)
+ Defect allowance (budgeted at 3–5% of order value ÷ units)
+ Administrative overhead allocation (per unit)
= TRUE LANDED COST PER UNIT
| Cost Category | Per-Unit Range (Low Volume) | Per-Unit Range (High Volume) | % of FOB Price (Typical) |
|---|---|---|---|
| FOB Manufacturing Cost | Baseline (100%) | Baseline (100%) | 100% (reference) |
| Customs duty / tariffs (US, Chinese origin) | 35% of FOB value | 35% of FOB value | 35% |
| Ocean freight (per unit) | $18–$45 | $10–$22 | 12–20% |
| Port handling (origin + destination) | $5–$15 | $2–$8 | 3–6% |
| Customs broker + MPF + HMF | $4–$12 | $2–$6 | 2–4% |
| Inland freight (destination) | $6–$18 | $3–$10 | 3–6% |
| Cargo insurance | $1–$4 | $1–$3 | 0.5–1.5% |
| QC inspection (amortised) | $3–$10 | $1–$4 | 1–3% |
| Defect allowance (3–5% of order value) | $3–$8 (per unit average) | $2–$5 | 2–4% |
| Inventory carrying cost (6-month hold) | $8–$20 | $5–$14 | 8–12% |
| Administrative overhead | $3–$10 | $1–$4 | 1–3% |
| TOTAL ADD-ON ABOVE FOB | $51–$142 per unit | $27–$76 per unit | 66–95% of FOB |
Table 4: Complete Per-Unit Cost Add-On Above FOB Price — Chinese Furniture Import to US Market (2025–2026). Assumes 35% total tariff rate. Ranges reflect low-volume (single 20ft container) vs. high-volume (3+ 40ft containers per year) scenarios.
Scenario Planning and Comparison
Best Case
43%Net saving vs. US domestic equivalent. High volume, favourable freight market, established supplier, low defect rate, efficient customs. Rare — requires everything to go right simultaneously.
Realistic Case
32%Net saving for a professional B2B buyer with established processes, 2–3 container shipments per year, 3% defect rate, independent QC. This is what most experienced importers actually achieve.
Worst Case
12%First-time importer, peak freight season, CBP hold, high defect rate, customs classification error, delayed delivery penalty. All costs materialise simultaneously.
Measuring True ROI Metrics
Beyond the per-unit landed cost, the metrics that define the true performance of a China furniture import programme are: Gross margin percentage (sell price minus true landed cost, divided by sell price — target 40–55% for a healthy B2B distribution operation); inventory turnover (annual units sold divided by average units held — low turnover amplifies carrying costs and compounds margin erosion); defect rate (% of imported units generating a warranty or return claim — each percentage point costs approximately 3–5% of that unit’s sell price in claim handling); and on-time delivery rate (% of orders delivered within the committed window — late delivery in project furniture contexts can trigger client penalties of 0.5–2% of project value per week).

Custom luxury furniture sourced from China — when all import costs are accurately modelled, net savings of 30–43% vs. domestic alternatives are achievable for professional B2B buyers with established supplier relationships and rigorous QC programmes.
Regional Alternatives and Comparative Analysis
Total Landed Cost Comparison by Source Region — Luxury Dining Chair, US East Coast (USD, Per Unit, 2026)
Illustrative all-in landed costs including manufacturing, freight, applicable tariffs, QC, and customs clearance. China’s 35% tariff burden (Section 301 + 122) narrows its cost advantage vs. Vietnam and SE Asia significantly in the US market. Source: Jade Ant Furniture analysis, tariffstool.com, industry data 2026.
The tariff landscape of 2026 has fundamentally changed the China-vs.-alternatives calculation for US-market buyers. With Chinese furniture carrying an effective 35% tariff burden and Vietnam operating at 10% (Section 122 only, following the SCOTUS ruling that struck down the higher IEEPA rates), Vietnam’s landed cost advantage over China in the US market has grown dramatically for buyers who had previously assumed China’s manufacturing cost advantage would overwhelm the tariff differential.
The practical implication: B2B buyers sourcing significant volumes for the US market should run a full landed cost comparison across China, Vietnam, and other ASEAN alternatives — not just a manufacturing price comparison. For buyers serving the EU market, where Chinese furniture faces no equivalent Section 301 tariff, the calculation remains more favourable toward China. For partners like Móveis Jade Ant, which provides detailed multi-country sourcing analysis as part of their B2B client advisory, this kind of origin comparison is a standard part of the purchase planning process.
📖 Key Terms: Furniture Import Cost Vocabulary
- FOB (Free on Board)
- The seller’s price covering manufacturing and delivery of goods to the named origin port, loaded onto the vessel. Risk and all further costs transfer to the buyer at that point. The most common Incoterm for Chinese furniture exports.
- CIF (Cost, Insurance, Freight)
- Seller’s price covering manufacturing, ocean freight to destination port, and basic insurance. Buyer controls nothing in the logistics chain and typically pays 8–12% more than FOB + independent freight rates.
- FCL / LCL
- Full Container Load (buyer pays for the entire container, regardless of how full it is) vs. Less than Container Load (buyer’s goods are consolidated with other shippers, priced per CBM). FCL is cost-efficient above approximately 15–20 CBM.
- HS Code
- Harmonized System code — the internationally standardised 6–10 digit number classifying every imported product. Determines which tariff rate applies. Misclassification carries CBP penalty of 20–40% of duties owed.
- Section 301 Tariff
- A 25% additional tariff imposed by the US on most Chinese-origin goods as part of the US-China trade dispute. Applies on top of the base MFN tariff rate. Separate from Section 122 tariffs.
- AQL 2.5
- Acceptable Quality Level 2.5 — a statistical sampling standard used in pre-shipment inspections. Means the shipment fails inspection if more than 2.5% of sampled pieces have critical defects. Industry standard for B2B furniture.
- Landed Cost
- The total cost of a product from factory gate to buyer’s warehouse, including all manufacturing, freight, tariffs, customs, and handling costs. The only number that matters for accurate margin calculation.
- Demurrage
- Daily charge for containers remaining at the port terminal beyond the free-time period (typically 3–7 days). Rates of $100–$500/day make CBP holds an expensive event.
- Carrying Cost
- The annual cost of holding inventory, typically 20–30% of inventory value, including capital cost, storage, insurance, handling, and obsolescence risk.
- Carta de crédito (LC)
- A bank-issued payment guarantee: the buyer’s bank guarantees payment to the seller’s bank once specified shipping documents are presented. Provides the strongest protection for both parties in high-value transactions.
Making Informed Import Decisions
Importing furniture from China can deliver significant cost advantages — but only when all expenses are transparently accounted for and modelled against realistic market conditions. The analysis in this guide demonstrates that a $100 FOB unit from China does not arrive at your US warehouse for $130; it arrives for $180–$210 after tariffs, freight, customs, QC, and administrative costs are included. That is still meaningfully below the $350–$500 equivalent from domestic or European production — but the margin of advantage is 30–43%, not 70%, and it requires professional procurement discipline to achieve consistently.
The most successful furniture importers — distributors, hotel fit-out specialists, and showroom operators who have built sustainable, profitable China sourcing programmes — share a common operating discipline: they calculate landed costs before committing to order quantities, they invest in quality inspection as a margin-protection measure rather than treating it as an optional expense, and they build supplier relationships over years rather than transactions. Many of them work with sourcing partners who provide the supplier access, QC coordination, and logistics expertise that transforms an apparently simple overseas purchase into a professionally managed supply chain.
Teams at Móveis Jade Ant work directly with B2B importers — distributors, interior designers, hotel designers, and showroom operators — providing transparent landed cost analysis, quality assurance coordination, and logistics support as an integrated service. If you are evaluating or scaling a China furniture import programme, the conversation begins with an accurate cost model — not a manufacturer’s discount claim.

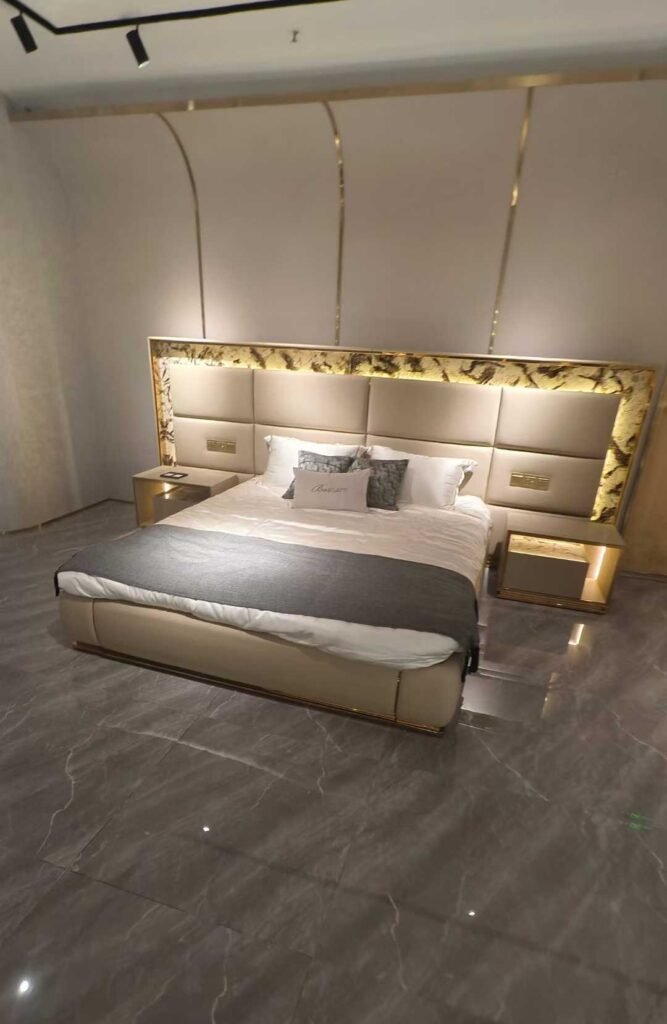
Premium bedroom furniture imported from China — the true ROI is achieved not through the headline discount, but through professional cost modelling, quality assurance discipline, and long-term supplier relationship management.
Perguntas frequentes
The following FAQs are designed to address the specific financial and operational questions that furniture distributors, agents, showroom operators, interior designers, and hotel fit-out specialists ask most frequently about China furniture importing costs.
Ready to Optimize Your Furniture Import Strategy?
Download our comprehensive Cost Breakdown Calculator — a detailed spreadsheet tool designed specifically for B2B distributors, showrooms, and interior designers. Input your product specifications, order volumes, and destination, and receive an accurate landed cost analysis with tariff estimates, shipping scenarios, and true ROI projections.
Our sourcing specialists at Móveis Jade Ant work with furniture importers, distributors, hotel designers, and interior designers to build transparent cost models and connect them with vetted Chinese manufacturers who deliver against specification, on time, and with full documentation.
- Access a complete, itemised landed cost calculation template
- Review current tariff rates and shipping scenarios by destination market
- Connect with vetted manufacturers for your specific product categories
- Navigate CARB, FSC, and fire safety compliance requirements
- Build a QC programme that protects your margins and client relationships